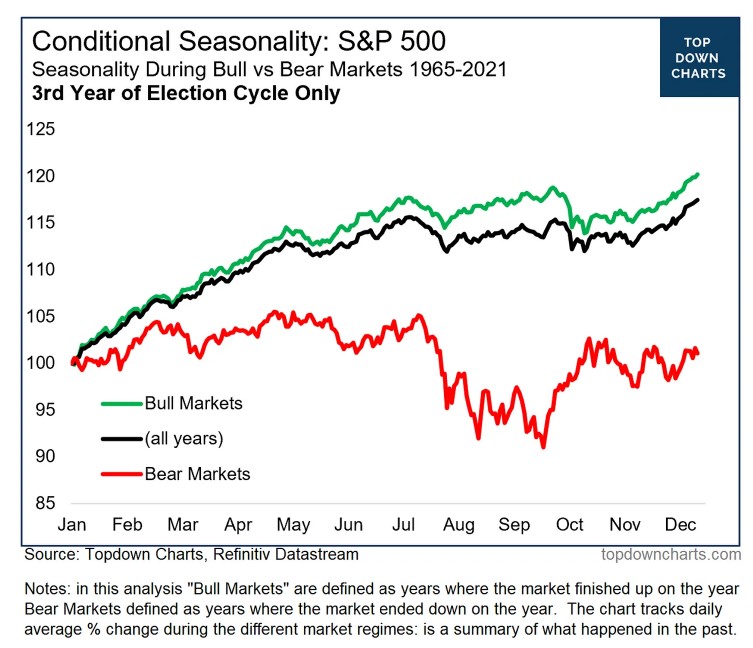
Callum Thomas provides an interesting chart in his weekly char pack about seasonality for S&P 500 in the 3rd year of an election cycle. According to his charts, the market is generally positive for the first half of the year. For the second half, the market remains around a certain level for until a further upward in December in bull markets, while the market keeps dropping until some rallies closing to year end in bear markets.
It briefly tells some factors related to US president play some roles market performance, but the question to ask is what they are and how they work.
Chen, Da, Huang and Wang (2023)’s work provides some interesting findings on how a president, or more precisely a president’s economic policies, impact cross sectional stock returns.
They construct a novel index called Presidential Economic Approval Rating (PEAR) index. They collected 1,713 polls from 21 polling organisation from April 1981 to December 2021, with a focus on responses specific to economic questions. The index is constructed by the simple average of approval ratings from polls available in each month with missing data filled with previous month’s value. From a pairwise correlation check with top 6 polling organisations’ results, the PEAR index is likely free of persistent bias in polling and less impact by dispersion in polling results.
Their regression controls for a set of macroeconomic variables to ensure PEAR betas contains PEAR-related information. It also includes a lagged change of PEAR to accommodate non-simultaneity between the poll time and return measurement. They run regression with a 60-month rolling window but implemented a backfilling for a new president with previous 47-month information from a president from the same party by assuming economic policies are somewhat stable within the same party. So, the final period for estimation of beta is from June 1983 to December 2019.
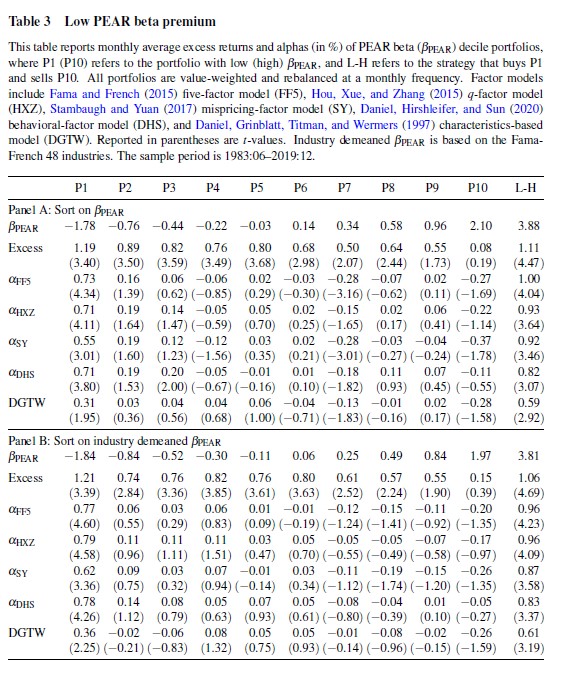
They formed 10 decile group value-weighted portfolios based on the size of PEAR betas in the prior month. The PEAR beta spread portfolio (Low Minus High) is a paper strategy buys stocks in smallest PEAR betas group and sells stocks in largest group. Rebalancing monthly, the average monthly excess return for the spread portfolio is 1.11%. Even tested with five-factor model, q-factor model, mispricing-factor model, behavioural factor model and DGTW characteristic model, at least 50% of the average monthly excess return of the PEAR beta spread portfolio is not explained. After tested again with industry demeaned PEAR betas, the low PEAR beta premium is not likely an industry-level phenomenon.
If investing for the low PEAR beta premium from June 1983 to December 2019, an investor makes a risk-adjusted profit of $39.65 compared to a Fama-French five factor portfolio in the same period. The portfolio implies an annual Sharpe ratio of 0.76, which is higher than that of the market. The premium is persistent and lasts generally up to 12 months.

Additionally, they found that the low PEAR beta premium is not partisan-dependent, and the premium exists in each year of a presidential term. The premium exists in both recession and expansion periods and across different firms. Checked in other G7 countries, they found the low PEAR beta premium continues to hold no matter what the economic closeness with the US.
They think the beta is a firms’ perceived alignment to the incumbent president’s economic policies and investors seem to misprice such an alignment.
Reference:
- Chen, Z., Da, Z, Huang, D., and Wang, L. (2023), Presidential economic approval rating and the cross-section of stock returns, Journal of Financial Economics, Vol 147, Issue 1, https://www.sciencedirect.com/science/article/abs/pii/S0304405X22002240
- Callum Thomas, Chart of the week – bear election seasonality, https://open.substack.com/pub/topdowncharts/p/chart-of-the-week-bear-election-seasonality?r=1iz693&utm_campaign=post&utm_medium=web
