Mai, Pukthuanthong and Zhou (2022) published a paper studying the return predictability of investor sentiment across four different asset classes including both traditional financial assets and bitcoin. The full paper can be found on SSRN: Mai, Pukthuanthong and Zhou (2022)
An early study by Baker and Wurgler (2006) provides some empirical justifications of using investor sentiment to predict cross-sectional returns. There are different ways to construct proxies for investors’ sentiment. The three researchers in this study introduce two types of sentiments namely trade-based sentiment and text-based sentiment, and they examine how good they are at predicting returns. They distinguish the two types of investor sentiment as each represents a different behaviour of investors.
The first type of investor sentiment is the text-based sentiment, which is derived from news sources and social media, reflecting the attention and beliefs of investors. A popular sentiment measure is the Refinitiv MarketPsych Indices (RMI). The indies are constructed based on news sources and social media contents, different content sources will have different sentiment series. The series can be constructed from the whole news article, only news headline, social media and combination of news and social media.
On the other hand, trade-based sentiment is obtained from trading information such as price and trading volume. It represents the actions of investors in the market. Price is a general indicator for actions but Baker and Wurgler (2007) talked that trading volume can also be a proxy for sentiment. The researchers calculated six measures from the prices and trading volumes data, including price-based William’s %R, nearness to a recent high, trading volume ratio, moving average signals, momentum-type measure and combination of both trading volume and prices.
Authors constructed 28 trade sentiment variables and 28 text sentiment measures in total. To avoid overfitting and make sure the comparison is parsimonious, they employ several methods to reduce dimensions. They employ four methods to test models and make forecast, including average variable, combination forecast, principal component analysis and partial least square. Out-of-sample $R^2$ is used to evaluate the performance of forecasting, and utility gain is also used as this measure taking risk preference into consideration.
From their empirical analysis between sentiments and asset returns
- trade sentiment measures overall have more significant level correlation with the four assets’ returns , indicating potential more accurate in predicting future returns
- Bitcoin have the most significant correlation relationships with both trade and text-based sentiment measures.
- In the in-sample test, trade based sentiment measures exhibit predicting future returns on Bitcoin, Treasury bonds and stocks at significantly more accurate level than text based sentiment
- To confirm their findings that text-based sentiment measures are less likely to forecast next period returns, they replicated early studies by Tellock (2007) and Garcia (2013). They found the predictability of text-based sentiment derived from news sources vanished over 2000-2005, and this may due to news information has been fully integrated into stock prices on the same day from then.
- Applying dimension reduction techniques to trade sentiment, text sentiment and both of them, trade sentiments still show that it’s better ability to predict future returns for Bitcoin and Stock.
- Trade sentiment are better predictors for bitcoins in the out-of-sample evaluated by R square.
- In very short forecast window, like next day, all models with trade sentiment measures encompass the forecast by text sentiment measures. Only except for some the partial least square treated trade sentiment measures model does not provide such support.
- By examine whether trading strategies derived from trade and text sentiments can benefit asset allocation, they found no evidence showing that these trading strategies can provide economic gain. Except for Bitcoin, trade sentiment measure trading strategies can provide some economic benefits.
Trade based sentiment measure
| No. | Measure | Formula | Explanation |
|---|---|---|---|
| 1 | TVS | where | |
| 2 | Williams’ %R | where are the highest and lowest daily prices of asset i over the window from day t-L+1 to day t. | |
| 3 | NHS | This measures the closeness of current price to the highest price over the period. | |
| 4 | MAS | 1 (formula listed below) | where |
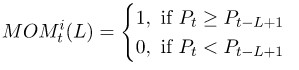
| 5 | Momentum-based | 2 (formula listed below) | A higher price level now than L days ago generates a buy signal |
| 6 | Combination of price and trading volume | where |
MAS

Momentum-based